Last Updated on September 14, 2026 by Caesar Fikson
TL;DR
- An iGaming CRM KPI dashboard should help an operator decide what to do today.
- Start with FTD rate, activation rate, bonus cost ratio, and churn rate.
- Show definitions, time windows, segments, and data freshness beside every KPI.
- Pair each metric with an owner and a decision threshold instead of treating the dashboard as a scoreboard.
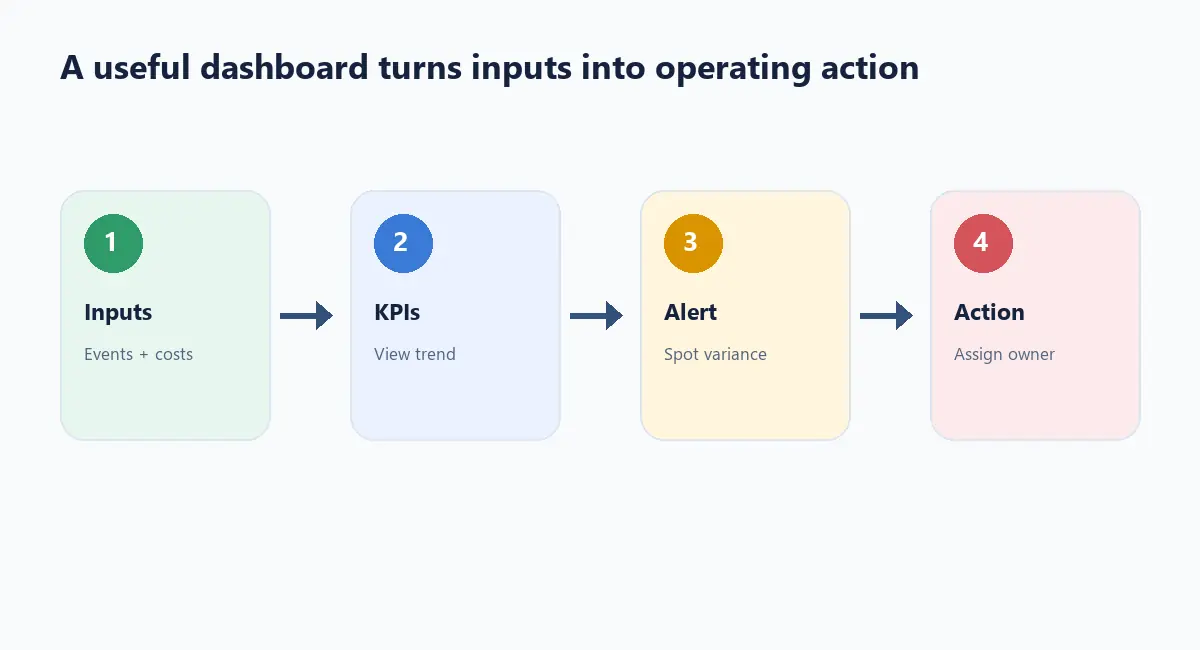
iGaming CRM KPI dashboard design is less about adding more charts and more about making the daily operating picture trustworthy. A useful dashboard tells an operator whether new players are reaching the intended first milestone, whether early activation is healthy, how much incentive cost is being used, and where retention risk is changing. It also makes clear when the data is incomplete.
What an iGaming CRM KPI dashboard should show daily
Key Definition: An iGaming CRM KPI dashboard is a decision-oriented view of player lifecycle metrics with explicit definitions, sources, time windows, owners, and recommended actions.
| KPI | Core question | Daily decision |
|---|---|---|
| FTD rate | Are eligible new accounts reaching first deposit? | Investigate onboarding or acquisition quality |
| Activation rate | Are new players completing the defined first-use action? | Improve setup, education, or journey timing |
| Bonus cost ratio | How much incentive cost is being used relative to the chosen value base? | Review offer design and eligibility |
| Churn rate | Which cohorts are losing qualifying activity? | Prioritise service, product, or retention analysis |
FTD rate: define the denominator first
FTD rate is often expressed as first-time depositors divided by eligible newly registered accounts during a stated period. The denominator must exclude test accounts, duplicate accounts, and records that were never eligible for the journey. A dashboard should show whether the window is same-day, seven-day, or cohort-based.
FTD rate = eligible first-time depositors ÷ eligible new registrations × 100
Activation rate: choose a meaningful first action
Activation might mean completing verification, making a first deposit, placing a first bet, playing a chosen product, or finishing a preference setup. Pick one definition for the dashboard and show supporting steps separately. When operators configure this workflow, we typically advise against calling any click “activation” simply because it is easy to count.
Use segments by acquisition source, jurisdiction, device, product, and onboarding path. A blended rate can hide a failure in one channel.
Bonus cost ratio: connect spend to purpose
Bonus cost ratio should state what is included: issued value, redeemed value, expired value, cash cost, or a finance-approved cost measure. It should also state the denominator, such as NGR or contribution margin. Avoid presenting a ratio without a cost definition.
Churn rate: show movement, not only a headline
Churn depends on the observation window and qualifying activity. Show new churn, returning players, unresolved data states, and the cohorts driving change. A sudden spike may reflect an ingestion failure or an expected seasonality shift rather than a product problem.
Implementation warning: never place a red or green colour on a KPI without showing its freshness and sample size. A visually confident number can be operationally wrong.
Build the daily review routine
- Check data freshness and failed event feeds.
- Review the four core KPI trends against the same prior window.
- Open one level of segmentation for any material movement.
- Assign an owner and a next action.
- Record the explanation, not only the number.
Operator pro-tip: add a “why this changed” note field. The note creates institutional memory and stops teams from repeating the same investigation every morning.
Illustrative daily example
Suppose a dashboard shows a stable registration count, a lower FTD rate, a flat activation rate, a higher bonus cost ratio, and an unchanged churn rate. The right first action is not to increase incentives. Check whether a payment method, verification step, or acquisition mix changed; then inspect bonus eligibility and cost allocation. These figures are illustrative and do not represent a NowG benchmark.
Edge cases and failure scenarios
Late-arriving deposits can change yesterday’s FTD rate. A duplicate player can inflate registrations. A bonus reversal can change cost after the campaign report is closed. A player moving between sportsbook and casino can appear inactive in one product while active in another. Document correction windows and show restated values when needed.
Conclusion
The strongest iGaming CRM KPI dashboard is a daily operating instrument: concise enough to review, explicit enough to trust, and connected to a decision owner. Start with FTD rate, activation rate, bonus cost ratio, and churn rate, then expand only when a new metric changes an action. See how our platform supports actionable CRM workflows at NowG.net.